Cell-type and brain-region resolved mouse brain proteome, Sharma et al.

Protein expression data of acutely isolated cells

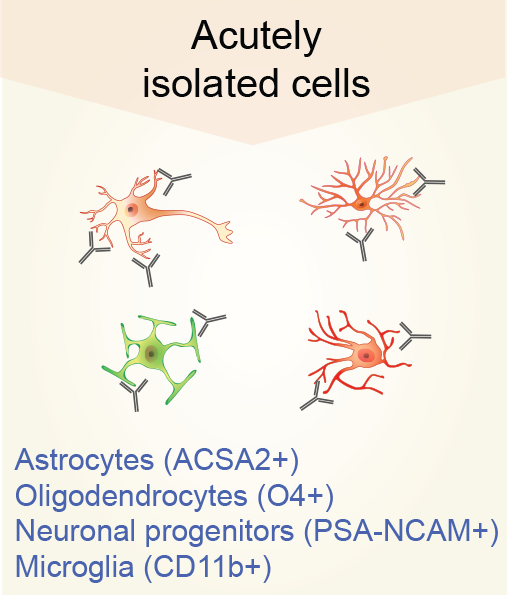
Protein expression in acutely isolated cells
Log2 fold difference over median abundance (LFQ intensity) in other cell types is indicated for each cell type. Cell type specific proteins (>10 fold different) in at least one cell type are indicated by “+”. Only proteins that were fully quantified in at least one cell type were included. For comparison, Log2 LFQ intensity of the cultured cells is also shown.

1

Differentially expressed 768 proteins in acutely isolated cells
Log2 fold difference over median abundance (LFQ intensity) in other cell types is indicated for each cell type and differentially expressed proteins (>10 fold different) are indicated by “+”.For comparison, Log2 LFQ intensity of the cultured cells is also shown.

Individual cell type data
The abundance and the enrichment information of proteins are provided for individual cell types to highlight the most abundant, yet cell type enriched proteins.

Datasets

All acutely isolated cells
Download table

Differentially expressed proteins
Download table

Astrocytes
Download table

Oligodendrocytes
Download table

Neuronal progenitors
Download table

Microglia
Download table