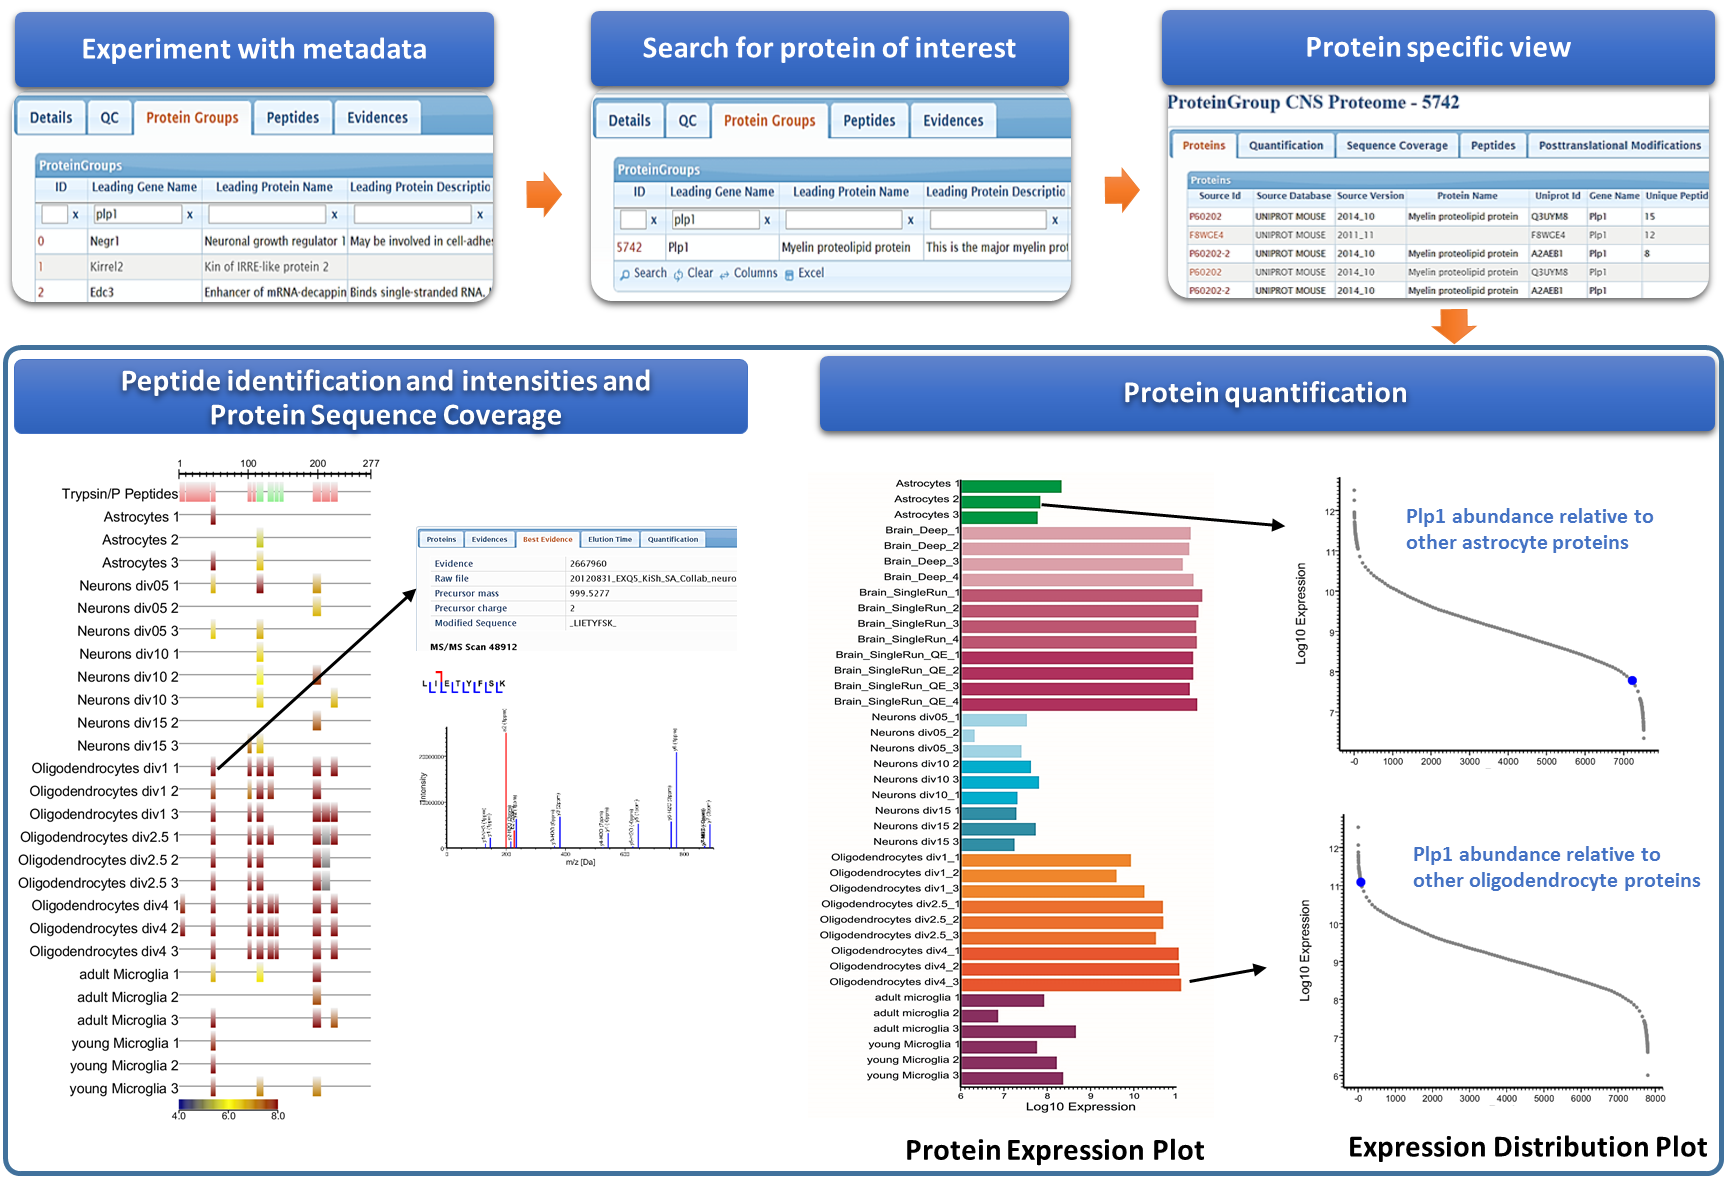
Advanced data visualization in MaxQB
|
Any protein of interest can be searched using ‘Protein Groups’ tab and by activating the ‘search’ option. The resulting protein quantification page (after clicking a selected protein group ‘ID’) allows visualization of protein quantification (using ‘Quantification’ tab) and of sequence coverage with a view of peptides identified. Peptides contributing to protein identification are visualized and can be further viewed as quantification panel and representative MS/MS spectra for peptide identification. MaxQB link |
||

|
